OSS Gains 26.23% to $10.54, Huge New U.S. Navy Contract
This morning, NIA sent out an alert about how its #1 overall stock suggestion for…
Important NIA Thursday Update
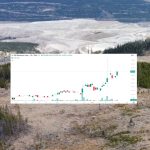
NevGold (TSXV: NAU) gained 8.49% yesterday to $1.15 per share on huge volume of 3.11…
One of NIA’s Biggest Days Ever Is Ahead
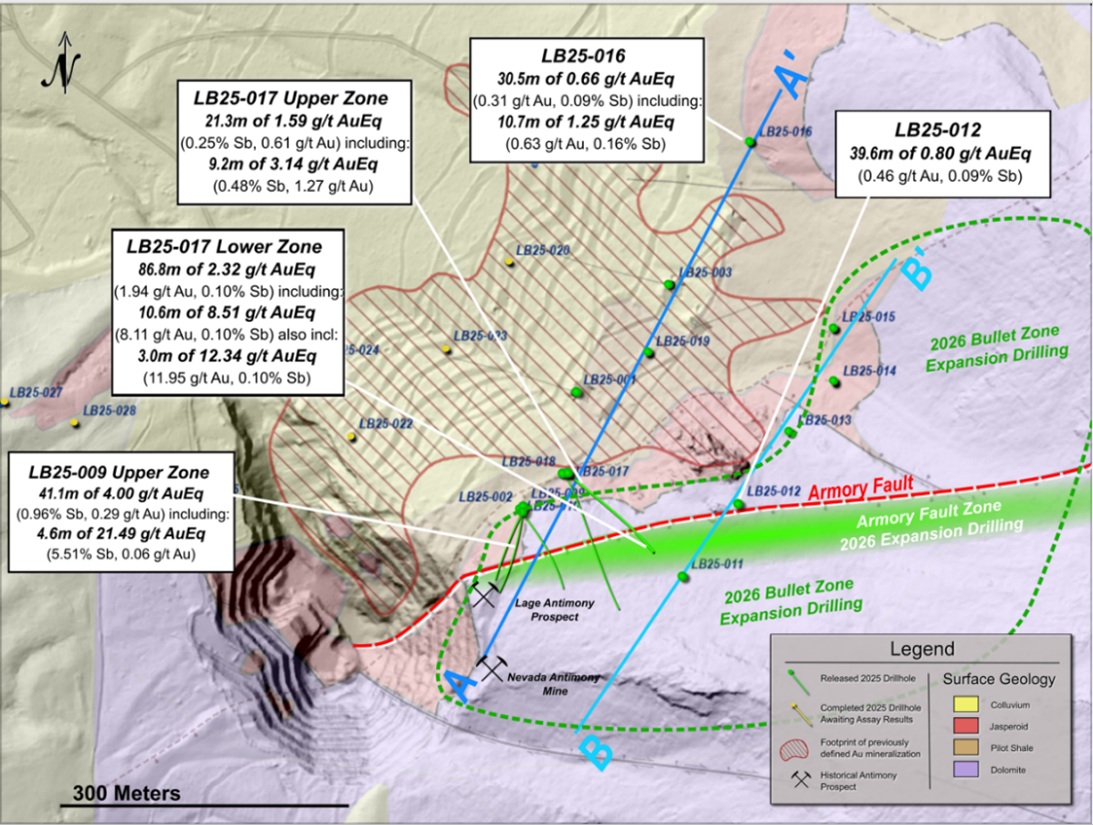
NevGold (TSXV: NAU) just announced this morning that it discovered a high-grade oxide gold-antimony “Armory…
NevGold Discovers High-Grade “Armory Fault”
NEVGOLD DRILLS 8.51 G/T OXIDE AUEQ OVER 10.6 METERS (8.11 G/T AU AND 0.10% ANTIMONY)…
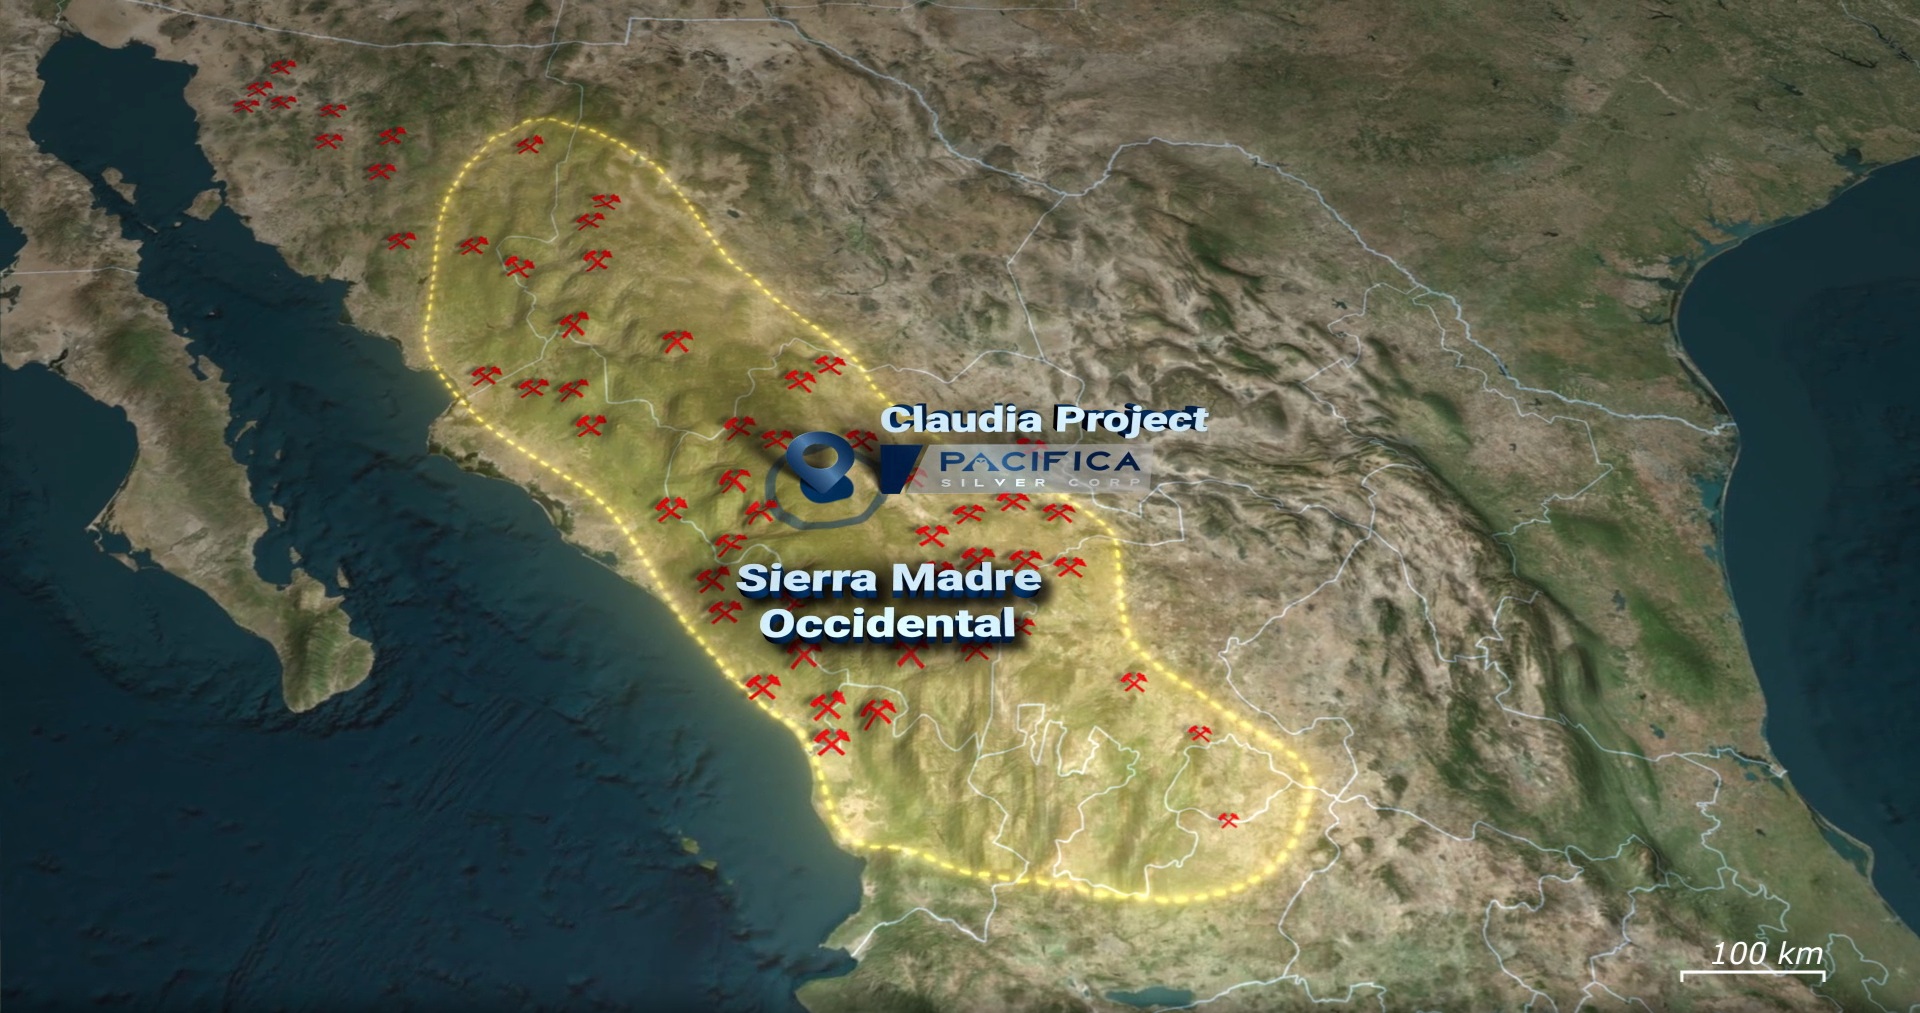
PSIL Delivers 2,074 g/t AgEq Intercept at Claudia
Pacifica Silver Reports Additional Drill Results at Claudia with Multiple High-Grade Silver-Gold Intercepts at the…
QIMC Drill Now Turning at West Advocate
QIMC Reports Diamond Drilling Underway at West Advocate Hydrogen Project, Nova Scotia Montreal, Quebec —…
NIA Warned About GSVR and GRSL One Week Ago
One week ago, NIA published an alert entitled, 'Vizsla Silver Smart to Diversify into Pacifica…
Pacifica Silver (CSE: PSIL) Could Be Best Opportunity in Market
Over the last ten years, the world's #1 largest gaining producing copper miner has been…
Super Copper Soars as CEO Buys More Shares
NIA's second to latest brand-new stock suggestion Super Copper (CSE: CUPR) surged 13.10% on Friday…
How to Know When Gold Has Peaked
NIA’s December 26, 2022 Gold Moon Indicator forecast that gold would rise from $1,753.50 per…

