Elevator Pitch for Beyond (BYON)
Beyond (BYON)'s 55% owned TZERO has the market leading tokenized security infrastructure. The second largest…
What a HUGE Day for NIA!
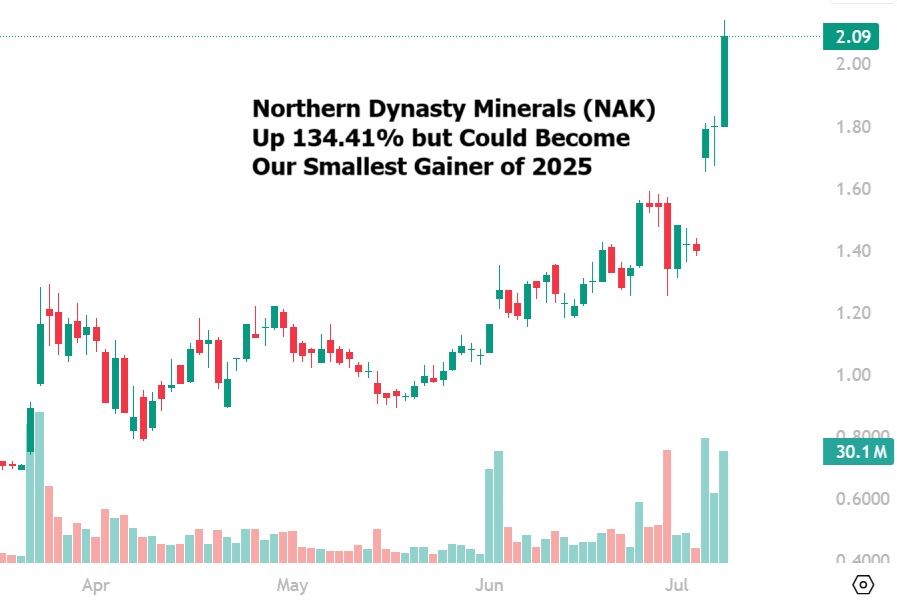
Northern Dynasty Minerals (NAK) gained by 16.11% today to $2.09 per share for a gain of…
Northern Dynasty Minerals (NAK) Igniting Retail Interest in Gold Stocks
Northern Dynasty Minerals (NAK) is the stock that is beginning to ignite retail investor interest…
Lynq Network Is Launching Next Week Using BYON’s TZERO
The Lynq Network is launching next week using Beyond (BYON)'s TZERO technology. It will allow…
Google Trends: Tokenization (Exponential Growth)
Here is a Google Trends chart for tokenization the area where Beyond (BYON)'s TZERO has…
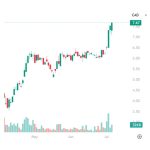
Beyond (BYON) Gains by 10.34% to $8.22 Per Share
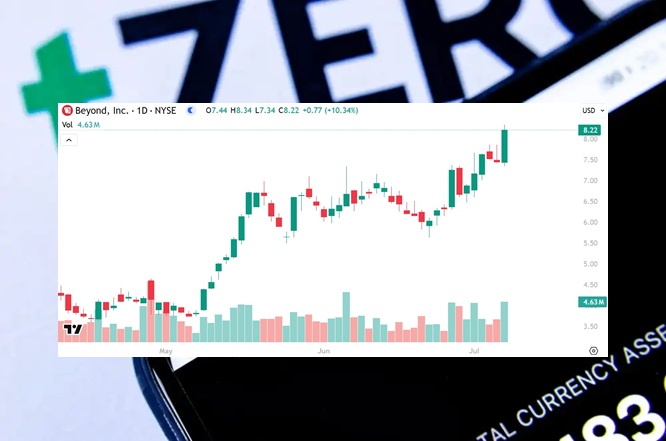
Beyond (BYON) gained by 10.34% today to $8.22 per share and has gained by 15.61%…
Beyond (BYON) Surpasses $8 Like NIA Predicted One Week Ago
One week ago, NIA sent out an alert entitled, 'Look for Beyond (BYON) Bounce to…
Important NIA Tuesday Morning Update
When Solaris Resources (TSX: SLS) gets acquired, Richard Warke will brag about its gains based…
SLS Closes at $7.82 Up 18.3% Since NIA’s Thursday Morning Alert
Solaris Resources (TSX: SLS) gained another 3.85% today to $7.82 per share, which is a…
Hydreight (TSXV: NURS) Gains by 16.32% to $2.21 Per Share
NIA's #1 favorite technology stock suggestion Hydreight (TSXV: NURS) gained by 16.32% today to $2.21…


