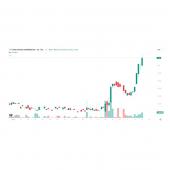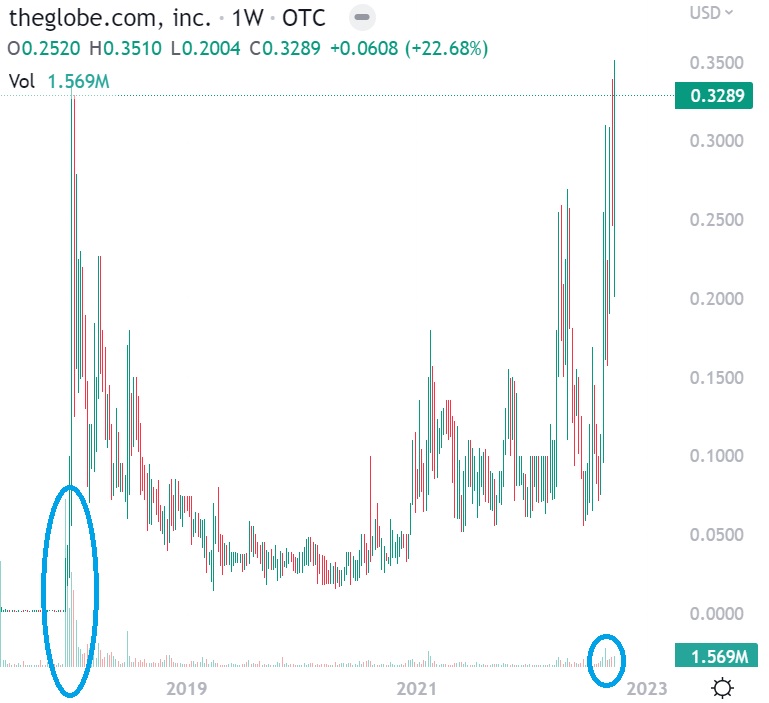
TheGlobe.com (TGLO) currently has the #1 most bullish chart that we have ever seen in our entire careers. Pay particular close attention to the massive volume that TGLO needed to trade when it first broke out in late-2017/early-2018 and compare to TGLO's miniscule volume traded in recent weeks. This means two things: 1) TGLO's float is being held tightly by people who are "in the know" about what is about to transpire with Delfin Midstream and their Final Investment Decision coming before year-end and 2) TGLO is undiscovered at this time among retail investors who are busy buying overvalued LNG stocks that already have multi-billion-dollar market caps while missing out on the one single opportunity where they can actually make a bloody fortune (TGLO will soon have a $5 billion+ market cap).
Past performance is not an indicator of future returns. NIA is not an investment advisor and does not provide investment advice. Always do your own research and make your own investment decisions. This message is not a solicitation or recommendation to buy, sell, or hold securities. This message is meant for informational and educational purposes only and does not provide investment advice.
Preparing Americans for Hyperinflation