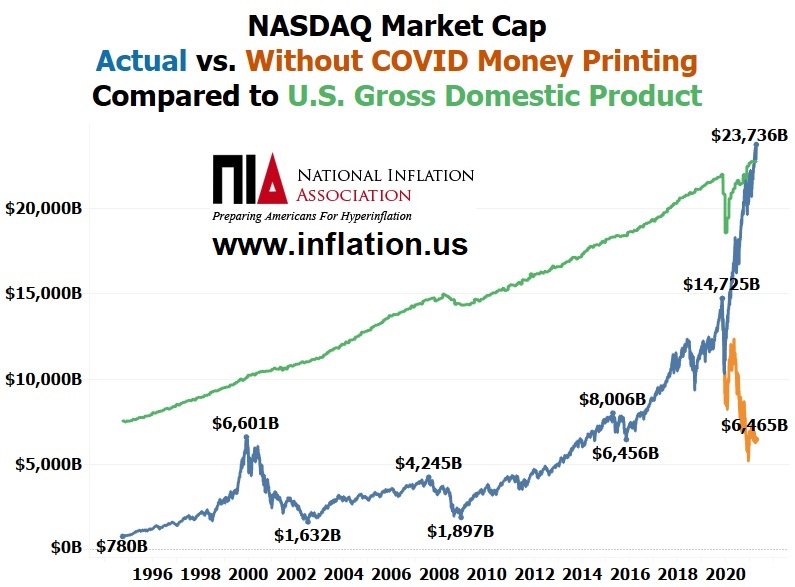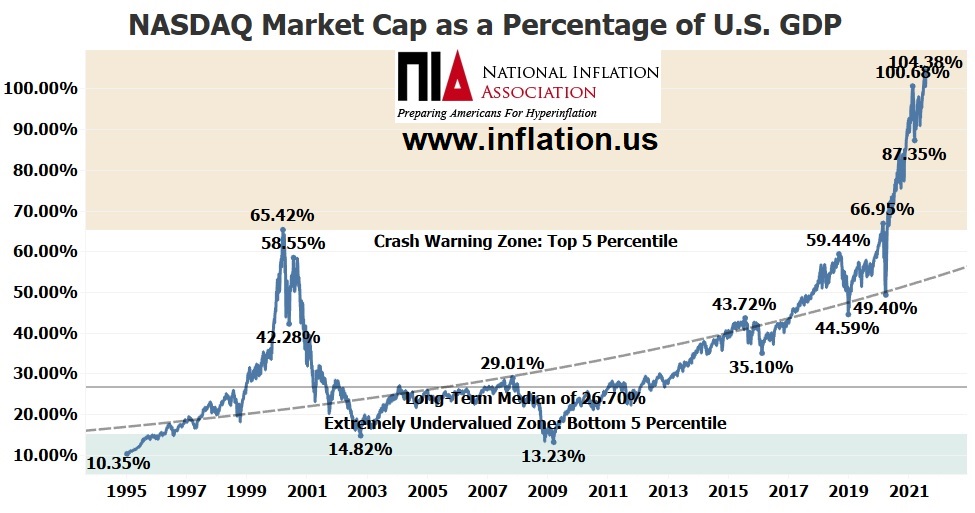
Prior to today's sharp decline in the NASDAQ Composite, the NASDAQ's market cap had reached a new all-time high as a percentage of U.S. GDP of 104.38%.
In comparison, at the peak of the dot-com bubble in March 2000, the NASDAQ's market cap/GDP ratio topped out at 65.42%.
Prior to the scamdemic in February 2020, the NASDAQ's market cap/GDP ratio reached a then record high of 66.95%, which was slightly above its dot-com bubble peak. The recession that was supposed to occur beginning in March 2020 was not allowed to take place due to the Fed printing $4 trillion causing the U.S. M2 Money Supply to increase by $8 trillion. The NASDAQ's market cap bottomed during the scamdemic at 49.4% of U.S. GDP compared to historical bottoms for the NASDAQ during the dot-com bubble collapse and financial crisis collapse of between 13.23% and 14.82% of U.S. GDP.

NIA estimates that if the Fed did not print $4 trillion during the scamdemic, the NASDAQ's market cap would currently be $6.465 trillion. With the Fed's $4 trillion in money printing and 0% interest rates, the NASDAQ closed Monday with a market cap of $23.736 trillion, which was overinflated by $17.271 trillion.