


Articles
Most Silver Stocks Are Extremely Overvalued
Most silver stocks are extremely overvalued relative to gold stocks. Highlander Silver (TSX: HSLV) we…
Articles
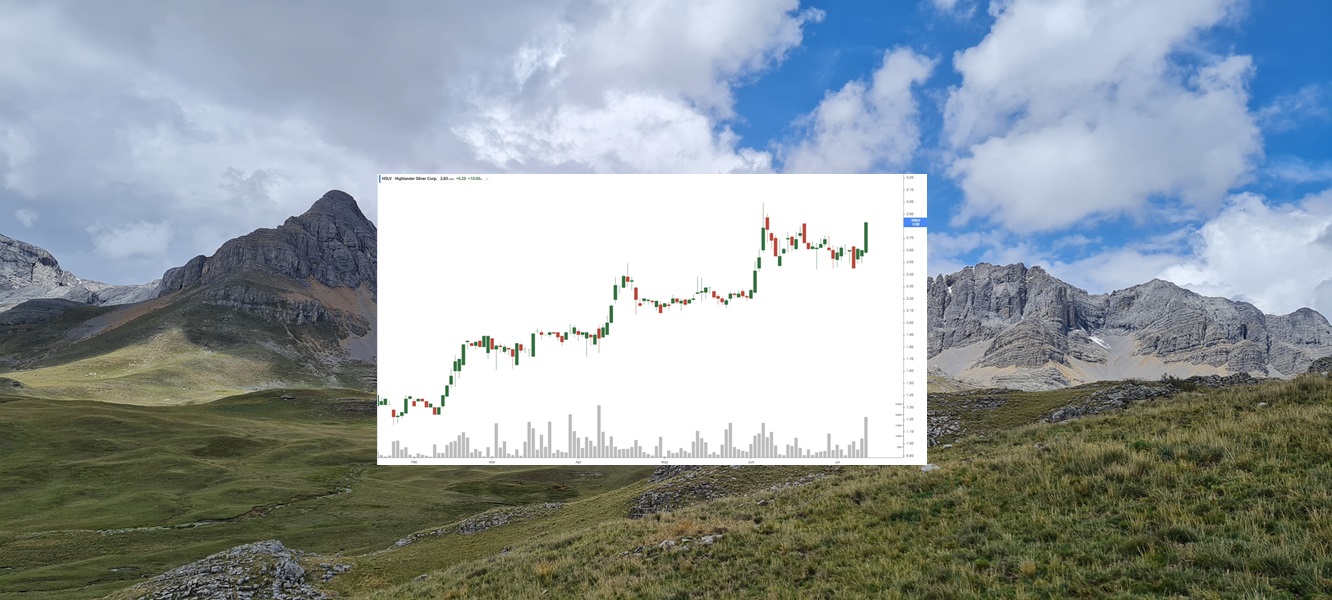
Highlander Silver (TSX: HSLV) Gains by 10.98% to $2.83 Up 102.14% Since NIA’s Feb 12th Suggestion
Highlander Silver (TSX: HSLV) gained by 10.98% today to $2.83 per share a new closing…
Articles
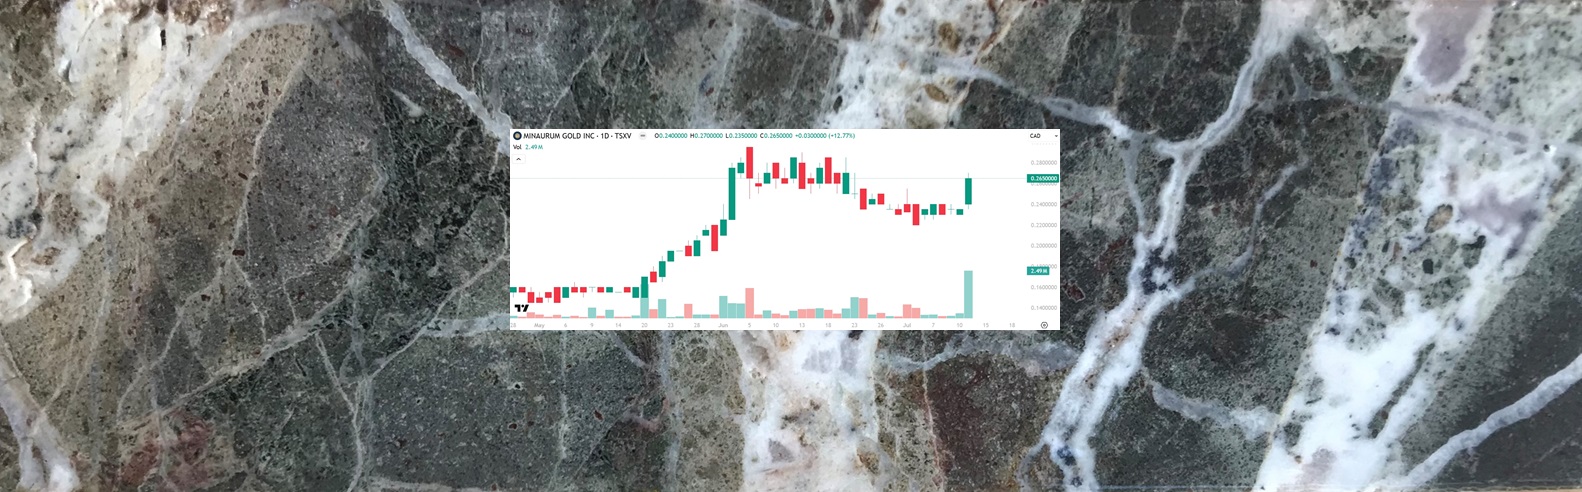
Minaurum (TSXV: MGG) Gains by 12.77% to $0.265, Fully Permitted High-Grade Silver
NIA's latest brand-new stock suggestion Minaurum (TSXV: MGG) gained by 12.77% today to $0.265 per…
Articles
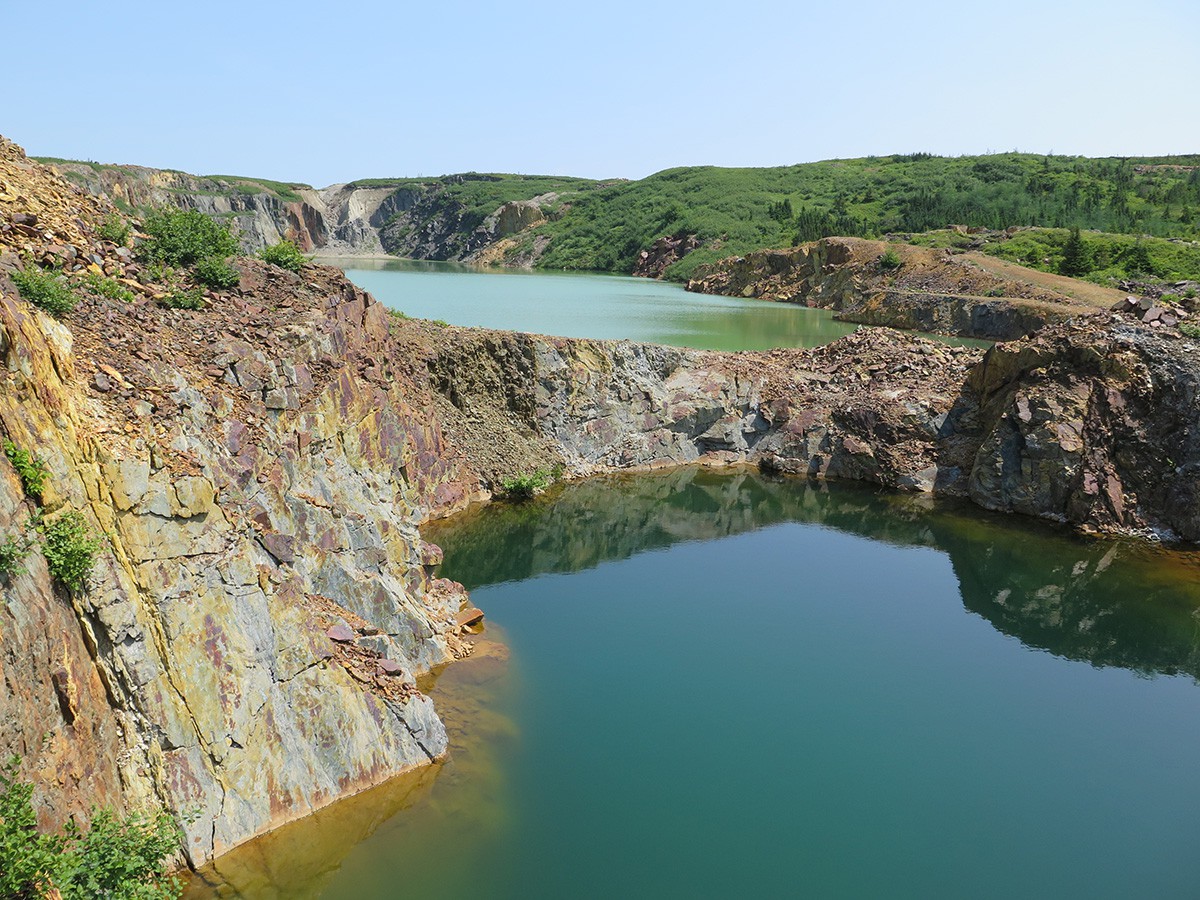
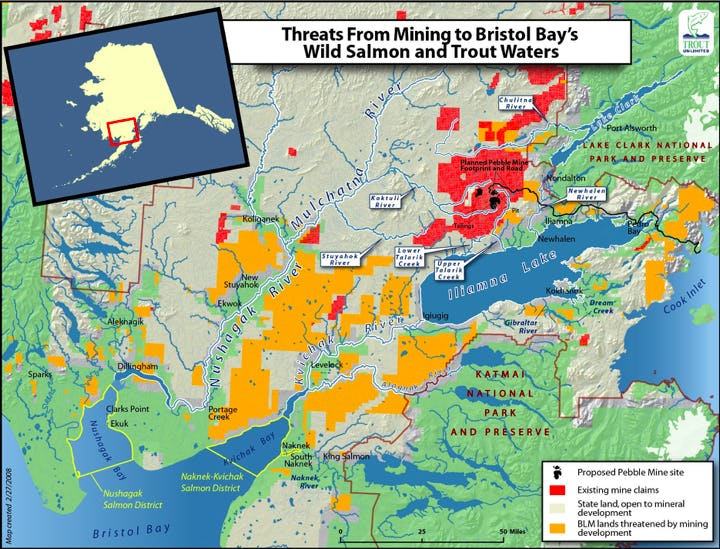
Focus on Fully Permitted Gold/Silver Projects
The endangered tiny little desert fish Speckled Dace near the Beatty Gold District is something…
Articles
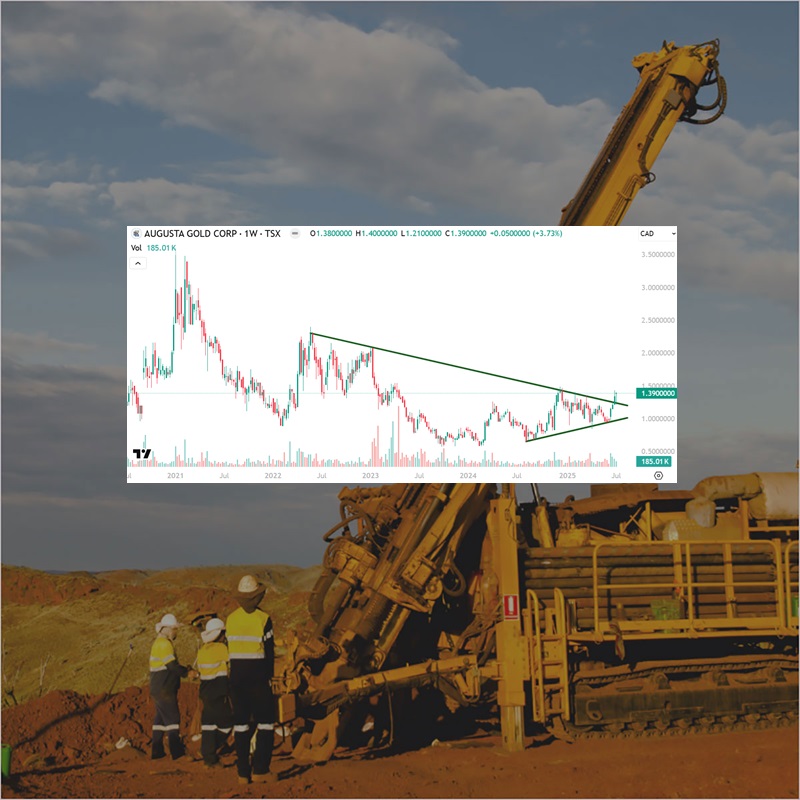
Augusta Gold (TSX: G) Gains by 2.96% to $1.39 Per Share
Augusta Gold (TSX: G) gained by 2.96% today to $1.39 per share and has the…

Articles
Hydreight (TSXV: NURS) Gains 19.60% to $2.38 Up 103.42% Since NIA’s Suggestion
NIA's #1 favorite technology stock suggestion Hydreight (TSXV: NURS) gained by 19.60% today to $2.38…
Articles
TSX Venture World’s Largest Gaining Market
The TSX Venture Composite Index is today's largest gaining market with an increase of 1.70%…
Articles
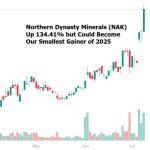
Gold Explorers to Outperform Producers as Retail Rushes to Capitalize
NIA's Northern Dynasty Minerals (NAK) is up another 4.31% in pre-market trading to $2.18 per…
Articles
Elevator Pitch for Beyond (BYON)
Beyond (BYON)'s 55% owned TZERO has the market leading tokenized security infrastructure. The second largest…
Technicals
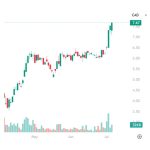
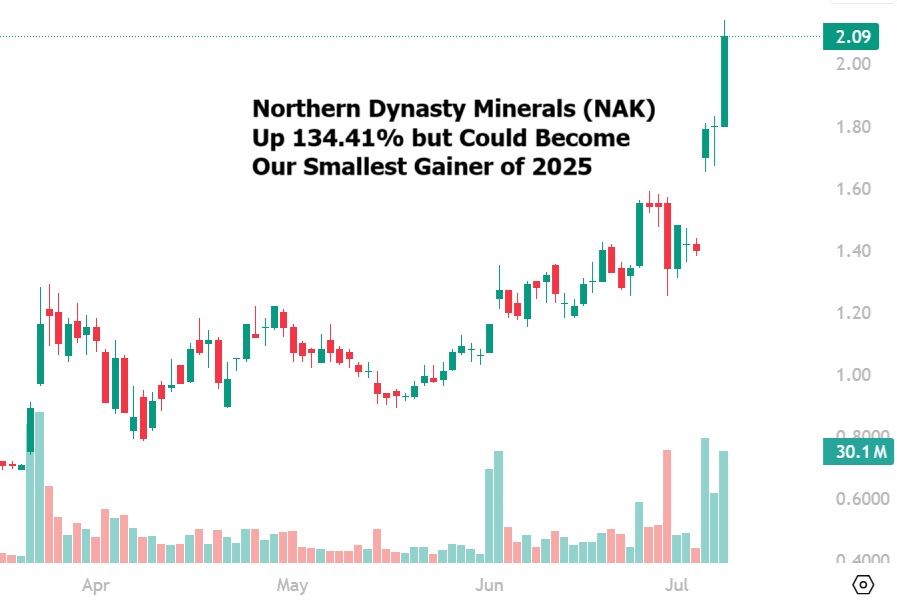
What a HUGE Day for NIA!
Northern Dynasty Minerals (NAK) gained by 16.11% today to $2.09 per share for a gain of…