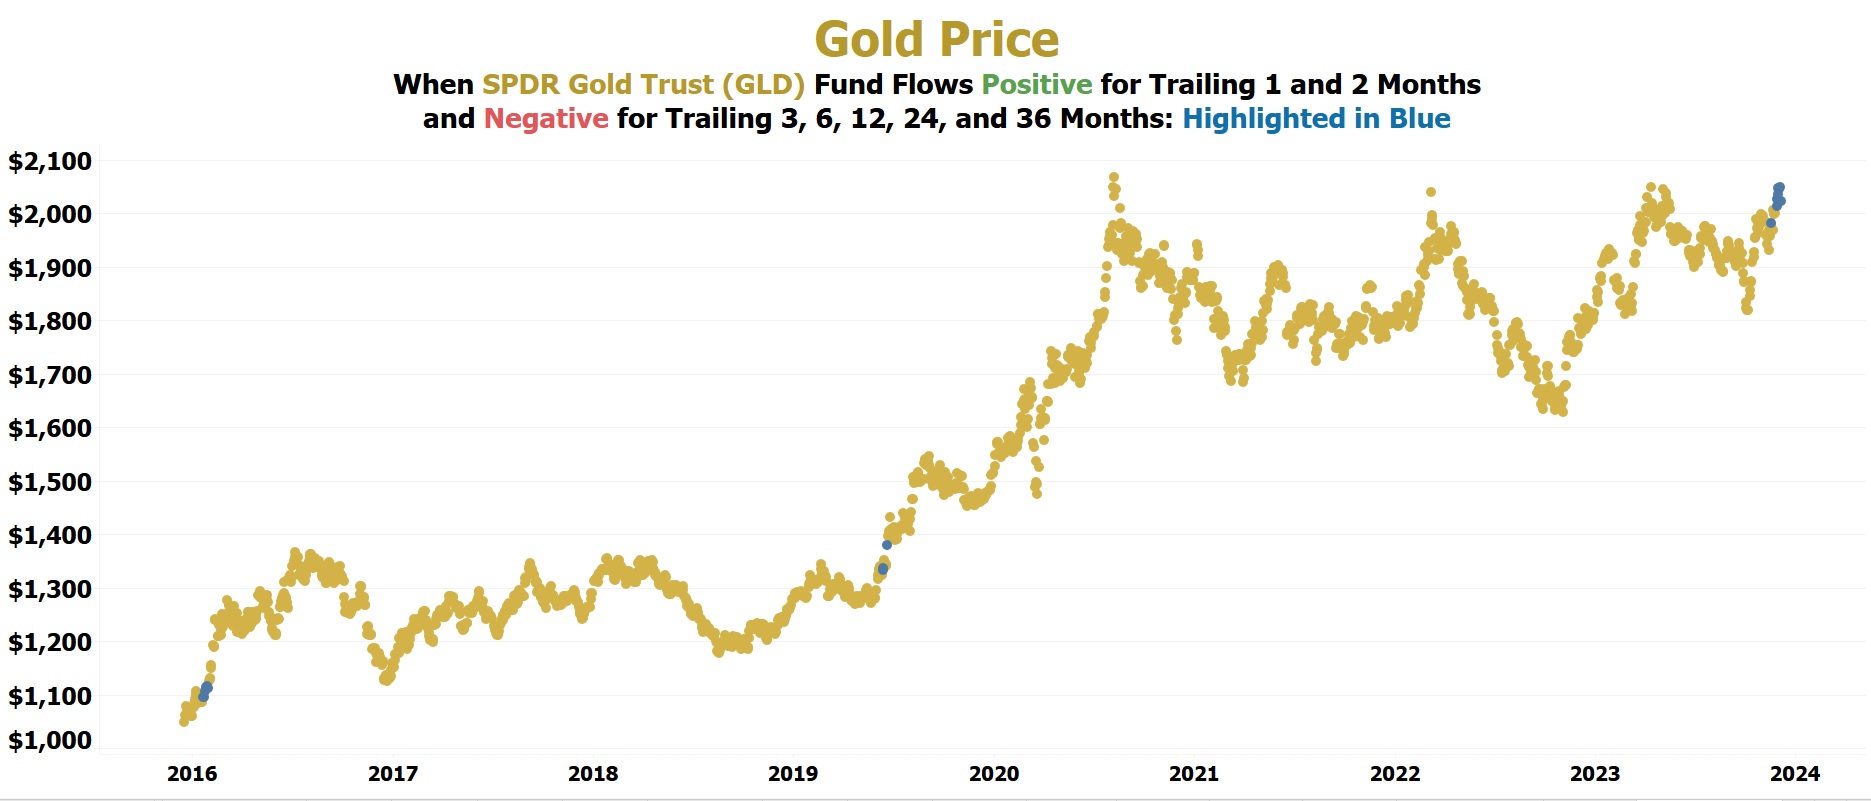
Gold is positioned today exactly like June 20, 2019.
Gold had resistance at $1,380 per oz that it first hit in mid-2016 and needed three years to break.
The #1 sign that occurred immediately prior to gold surpassing this resistance was SPDR Gold Trust (GLD) seeing its 1 and 2 month fund flows turn positive vs its 3, 6, 12, 24, and 36 month fund flows remaining negative. This indicator occurred on June 20, 2019, with gold at $1,379.50 per oz.
After gold settled for the first time above its $1,380 per oz resistance in the following days, it never traded below $1,380 per oz again.
Between June 20, 2019, and August 6, 2020, gold gained by 49.85% to $2,067.15 per oz.
Many small-cap gold explorers became 10 and 20 baggers between June 20, 2019 and August 6, 2020.
Today, we have exactly the same indicator that we last saw on June 20, 2019, with SPDR Gold Trust (GLD) seeing its 1 and 2 month fund flows turn positive vs its 3, 6, 12, 24, and 36 month fund flows remaining negative.
