


Articles
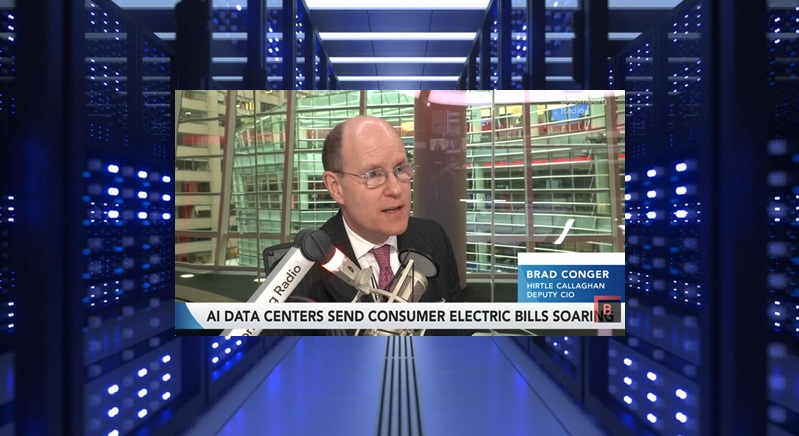
Leopold Aschenbrenner Invested in World’s Most Worthless Companies
If every dollar that has been spent building AI data centers had instead been used…
Articles
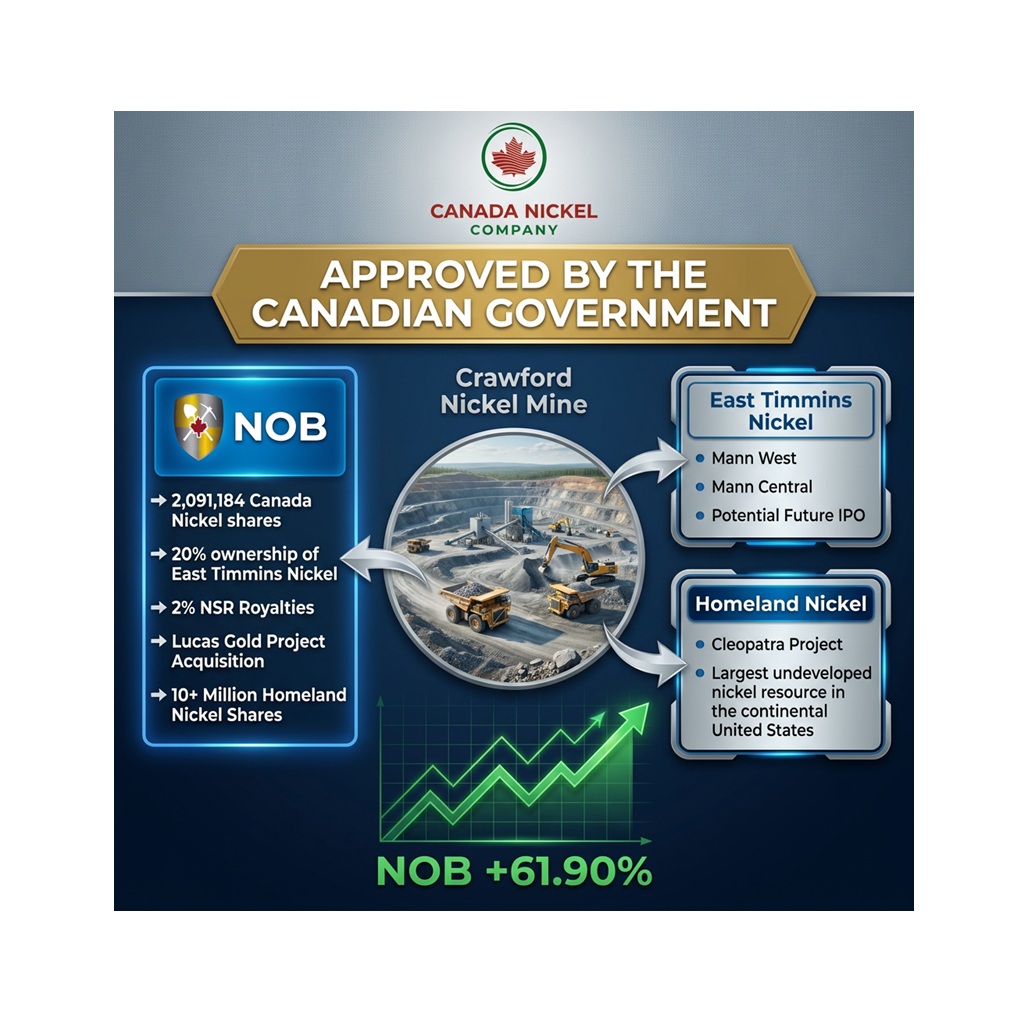
NOB Jumps 61.90% as Canada Approves Crawford Nickel Mine
Noble Mineral Exploration (TSXV: NOB) soared 61.90% today to $0.085 per share On reports that…
Articles
Wayback Machine Shows Temas Superior to 2012 Argex
Argex Titanium reached a market capitalization of CAD$160 million in December 2012, approximately 15 times…
Articles
North America Has No Producing Vanadium Mines
North America currently has no vanadium mines, but President Trump considers vanadium one of the…
Articles
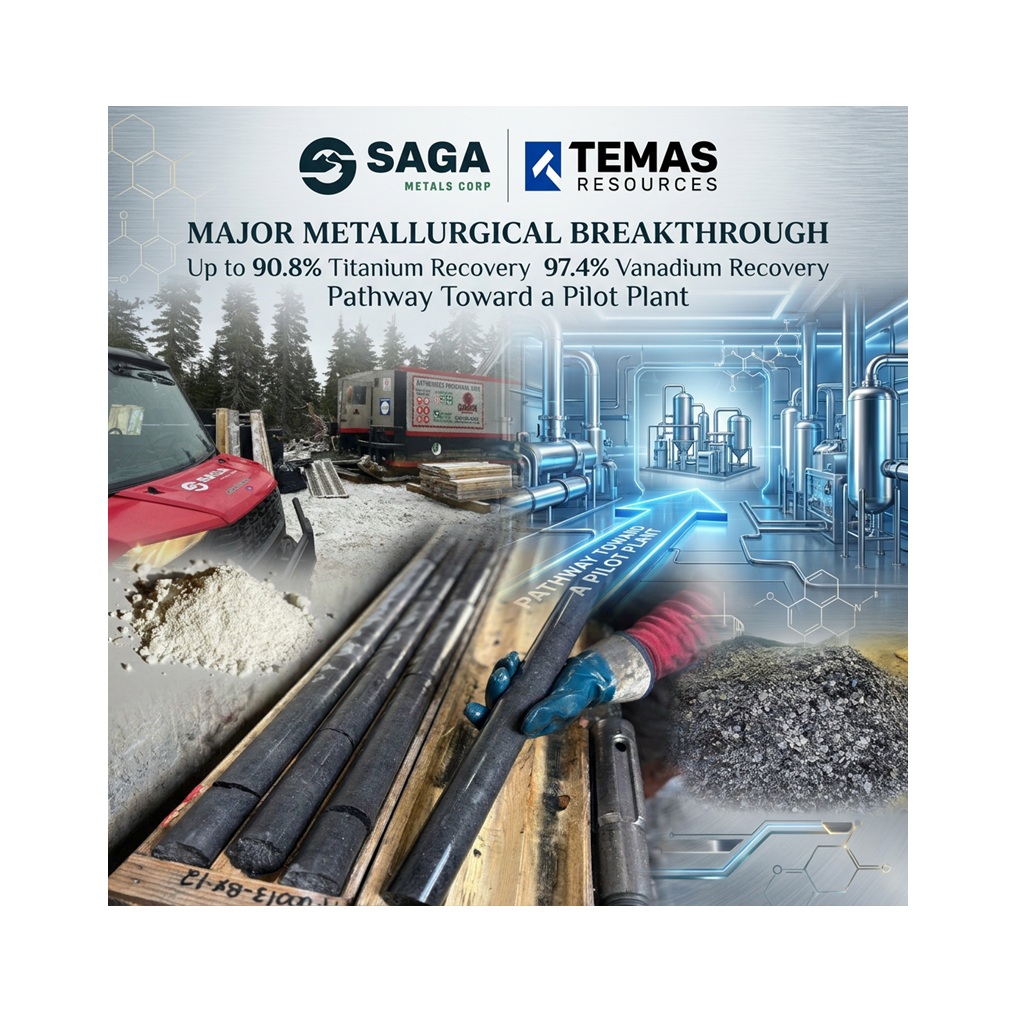
NIA’s Two Favorite Stocks Announce a Major Breakthrough
SAGA Metals and Temas Resources Successfully Complete Metallurgical Scoping Test Achieving Vanadium Recoveries of 97.4%…
Articles
Going All-In on Football Stocks
Is it a good idea to go all in on Celtic plc (LSE: CCP), Manchester…

Technicals
AJAX Skyrocketing Since NIA’s Football Report
AFC Ajax (AMS: AJAX) is the fourth best professional football stock because, as we discussed…
Technicals
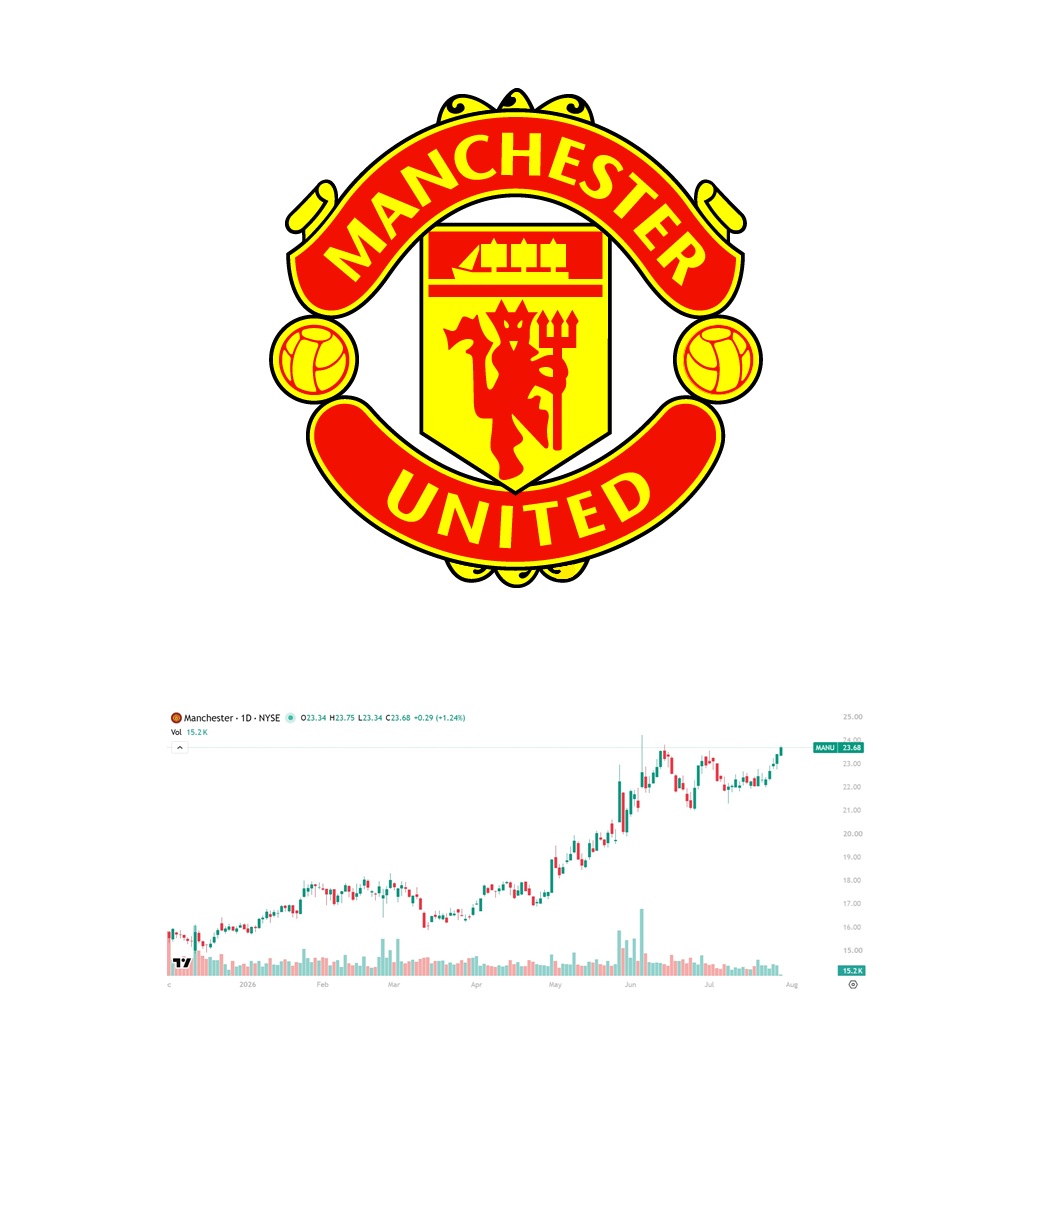
MANU About to Hit New Highs, Cleaning Up Resistance in BVB
NIA's #2 favorite professional sports stock suggestion Manchester United (MANU) is up by 1.24% today…

Technicals
CUPR Gains 5th Time in 6 Days
Super Copper (CSE: CUPR), the copper platform portfolio company of Christian Angermayer's Apeiron Investment Group,…

Articles
NIA’s Pierre Poilievre-Themed “Common Sense” Alert
We always love looking at the sentiment of dumb money by reading Reddit posts. If…