


Announcement
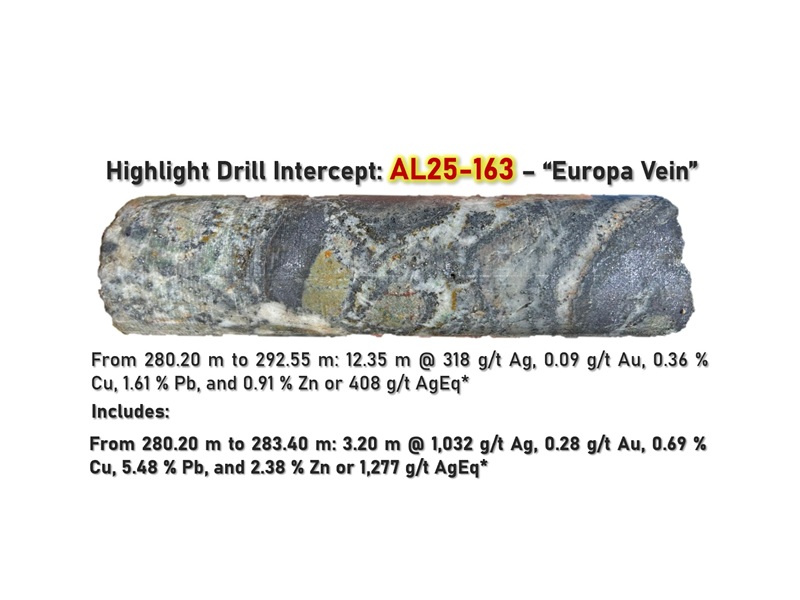
MGG Hits 1,277 g/t AgEq in 250m Step-Out at Alamos
Minaurum Drills High-Grade Silver in 250 m Step-Out at Alamos Silver Project: 12.35 m of…
Announcement
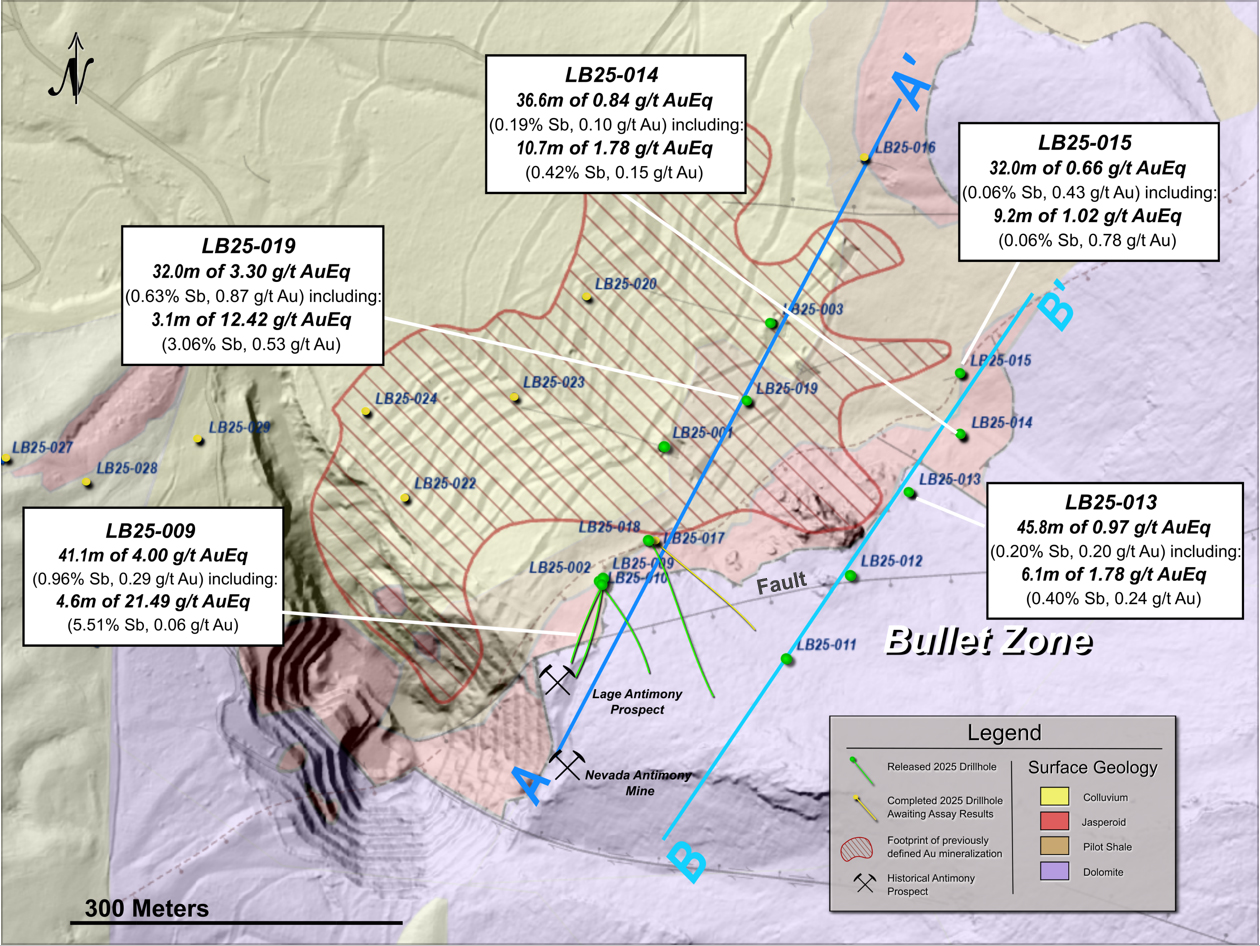
NevGold Hits 12.42 g/t AuEq Oxide Gold-Antimony in Nevada
NevGold – Limousine Butte Gold-Antimony Drill Results NevGold Intercepts 12.42 g/t AuEq Oxide Gold-Antimony at…
Articles
Vizsla Silver Smart to Diversify into Pacifica Silver
Yesterday morning, NIA announced Pacifica Silver Corp. (CSE: PSIL) as its latest brand-new stock suggestion.…
Articles
New NIA Silver Stock Suggestion: Pacifica Silver
NIA is excited to announce a brand-new silver stock suggestion Pacifica Silver Corp. (CSE: PSIL)…
Articles
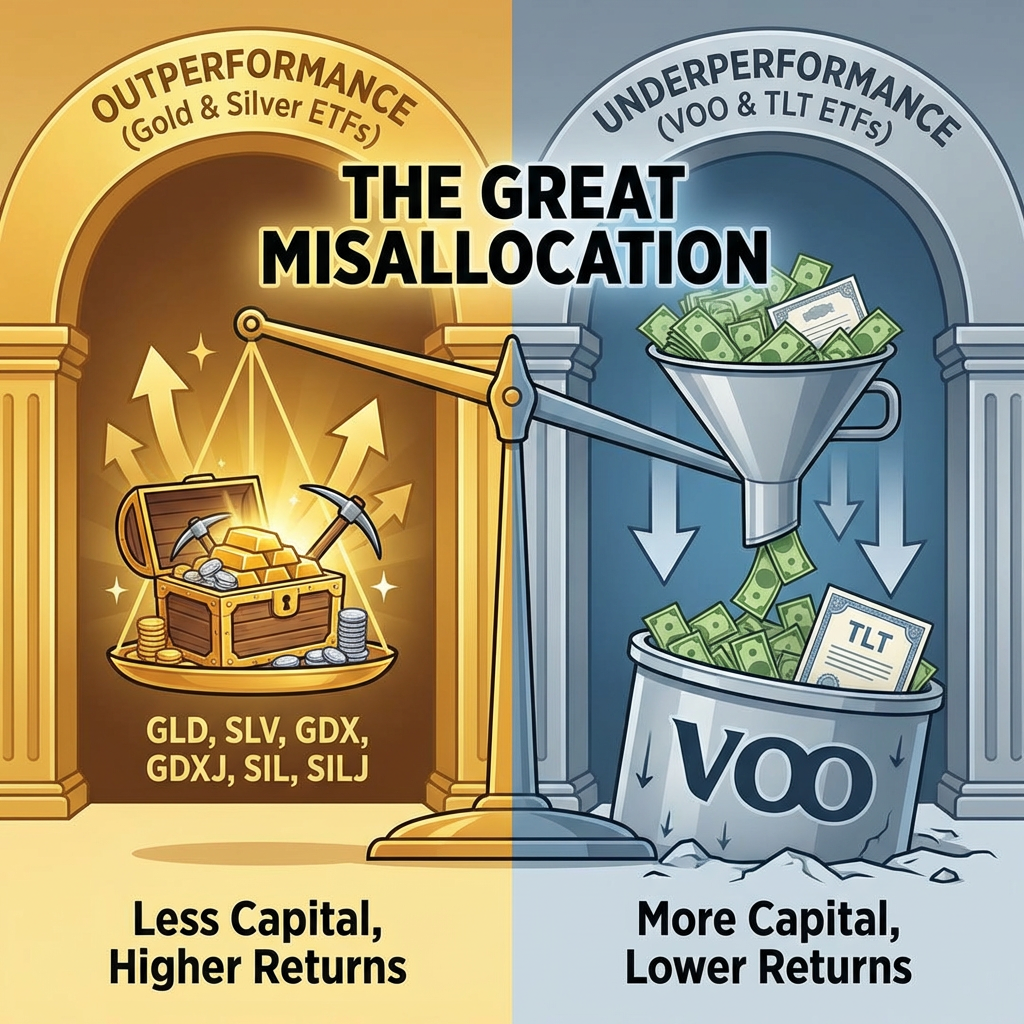
$396 Billion Into Stocks… $4 Billion Into Gold & Silver
Over the past decade, investor capital has flowed in the exact opposite direction of performance.…
Articles
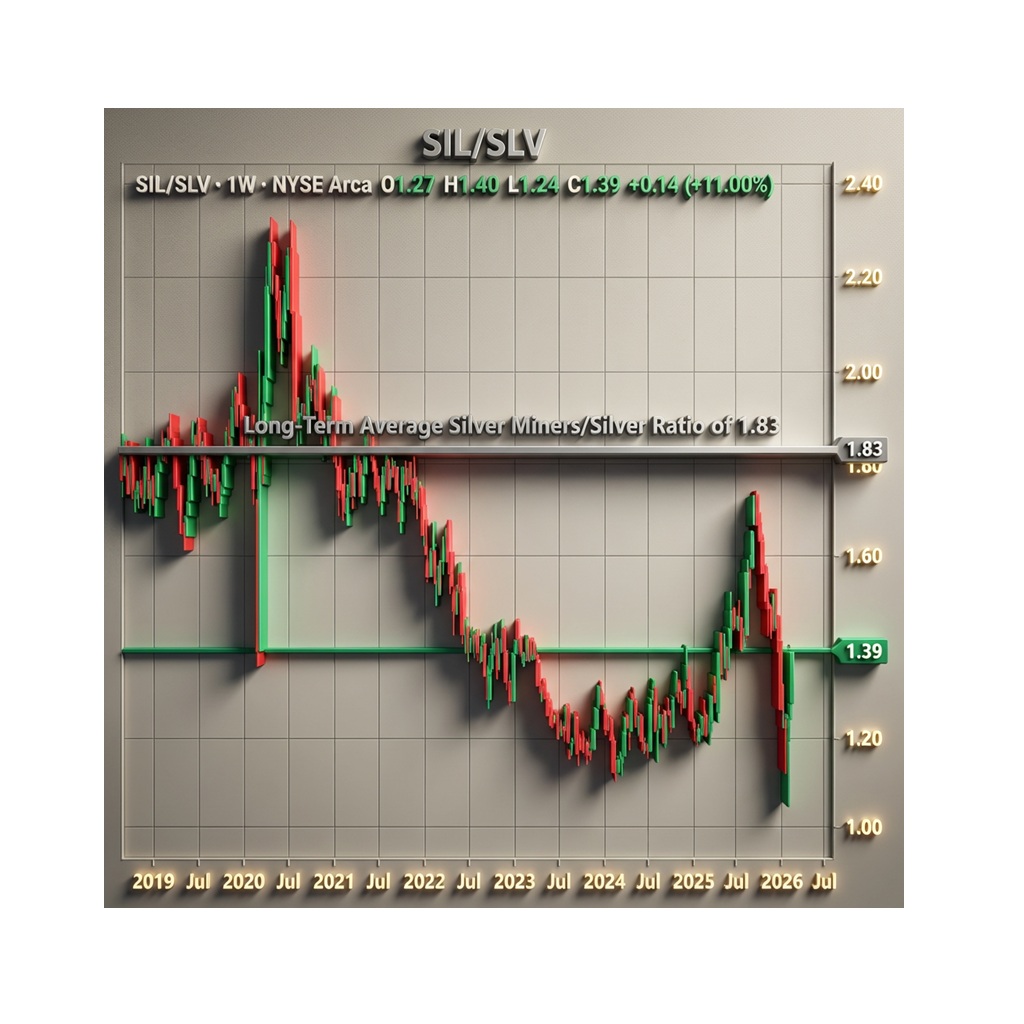
The SIL/SLV Ratio Just Flashed a Major Buy Signal
When silver plunged by 26% to $85.31 per oz on January 30th, NIA highlighted the…
Articles
Mike Alfred’s ASST Crashes Another 40% Does Reverse Split
NIA pointed out this past weekend how social media influencer Mike Alfred was trying to…
Announcement
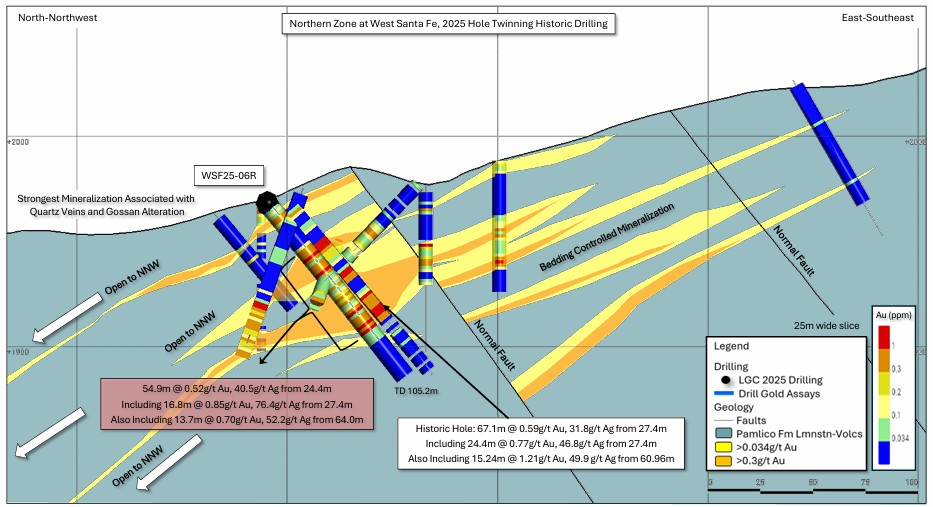
Lahontan Maiden Drilling Confirms Shallow Oxide Gold at West Santa Fe
55m of Oxide Gold at West Santa Fe Only 13km From LG's Flagship Santa Fe…
Articles
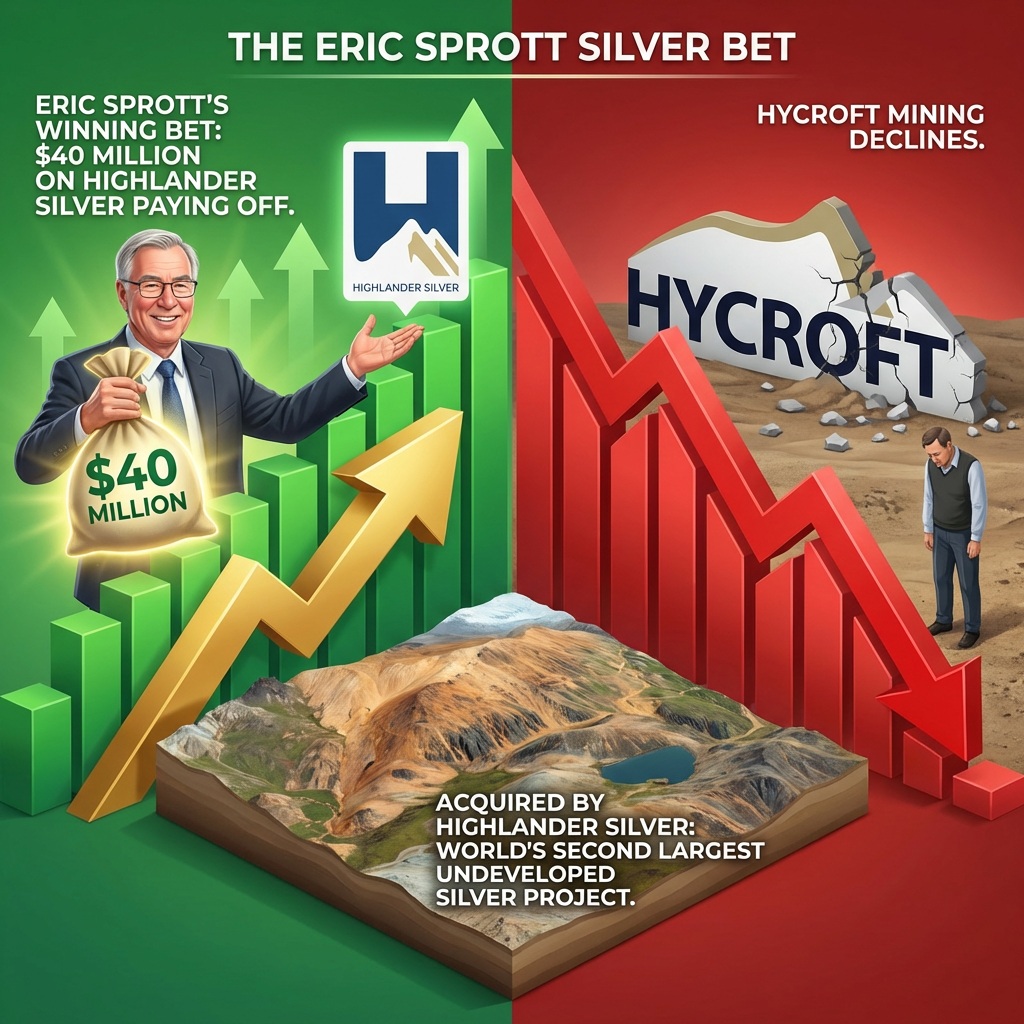
Eric Sprott’s $40M Bet Is Paying Off Already
Highlander Silver (TSX: HSLV) gained by 4.02% today to $7.76 per share vs. Hycroft Mining…

Announcement
QIMC Initiates Phase 1 Drilling in West Advocate, Nova Scotia
QIMC Initiates Phase 1 Drilling in West Advocate, Nova Scotia Following Receipt of Regulatory Approval…