


Articles
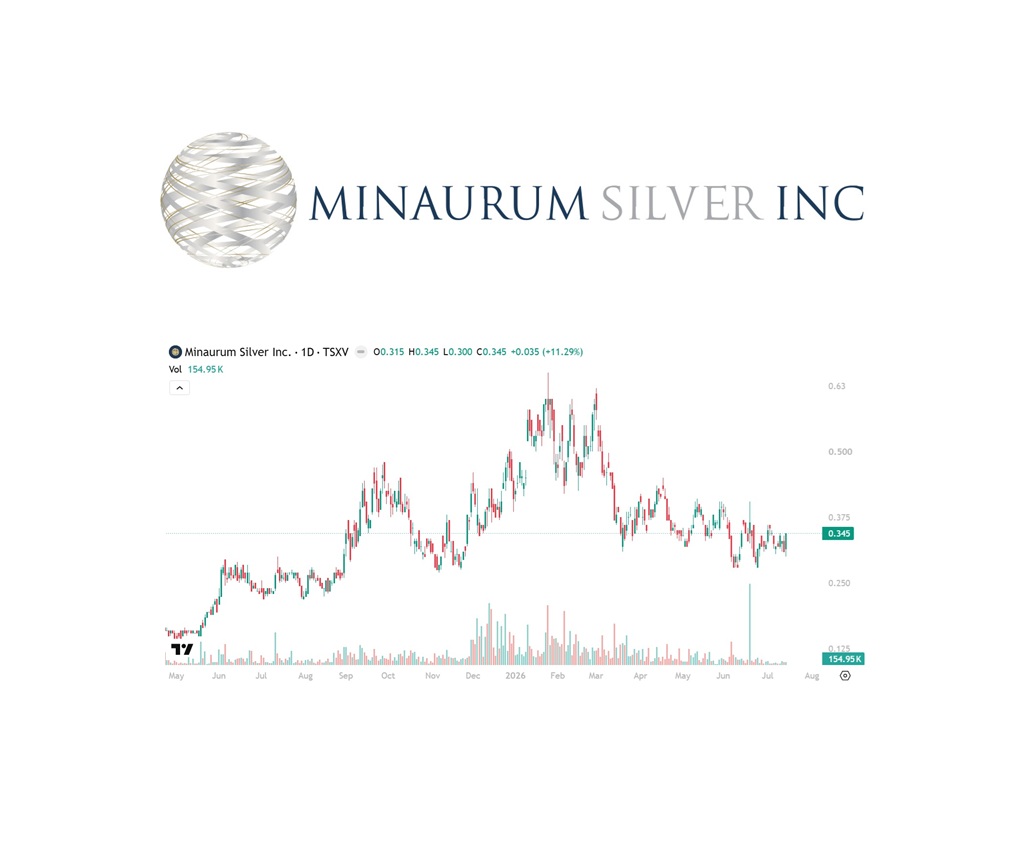
Minaurum Silver Soars 11.29% to $0.345, Highest Close Since Latest Drill Results
Minaurum Silver (TSXV: MGG) gained by 11.29% today to $0.345 per share on a weak…
Articles
Urgent NIA Wednesday Afternoon Update
National Inflation Association NIA INVESTOR ALERT Wednesday, July 15, 2026 ★ Top Pick — Drill…
Articles
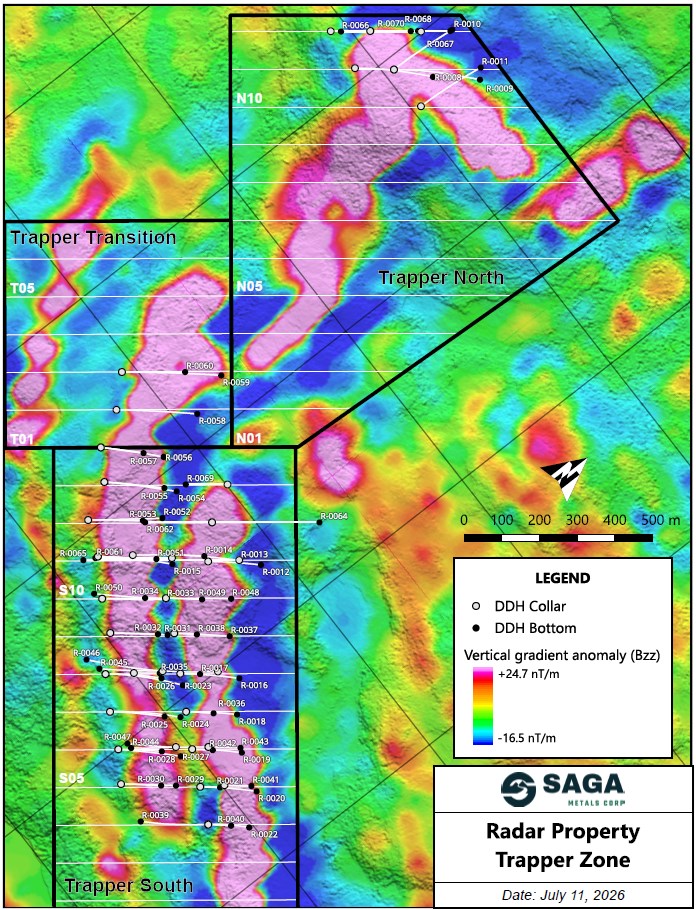
SAGA Keeps Delivering! More High-Grade Assays Released Today (Maiden Resource Is Getting Bigger with Every Drill Hole)
SAGA Metals Reports Assays from R-0047 to R-0049 with Intercepts Including 53.72% Fe2O3, 7.32% TiO2,…
Announcement
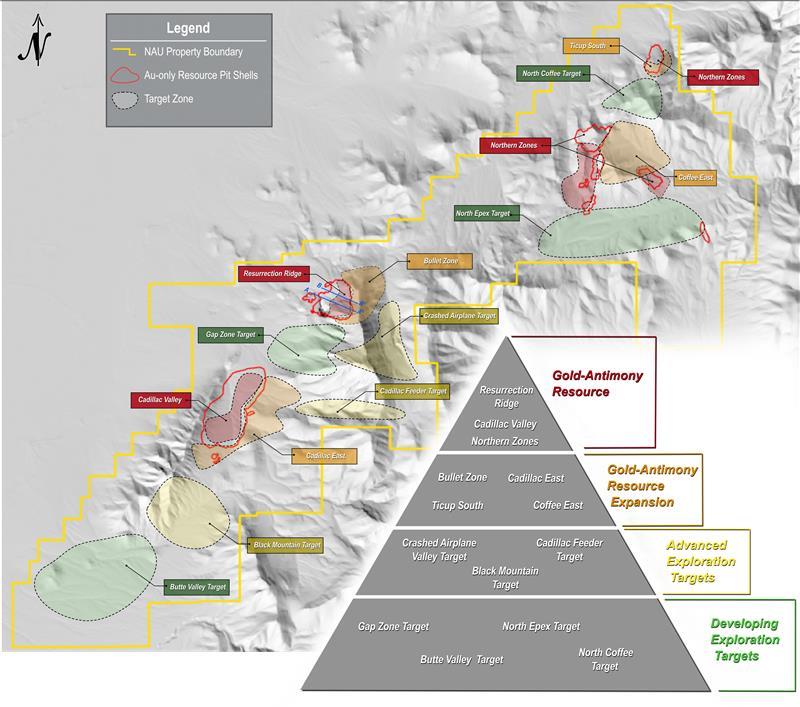
NevGold Delivers One of America’s Largest Strategic Antimony Resources
NEVGOLD ANNOUNCES MINERAL RESOURCE: ANTIMONY OF 29,600 TONNES MEASURED & INDICATED (0.26%) AND 48,100 TONNES…
Announcement
Titan Just Validated Its Entire Graphite Processing Chain
Titan Mining Validates Kilbourne Graphite Concentrator Flowsheet and Achieves Battery-Grade Purity July 15, 2026 06:00…
Articles
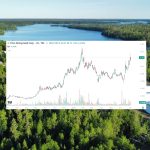
2026 Fourmile Gold Rush vs. 2017 Pilbara Gold Rush
The trenching that Westward Gold (CSE: WG) has done definitely reminds us of early-2017 prior…

Technicals
Westward Gold Gains Another 4% to $0.13: Drilling Next to Fourmile the Largest High-Grade Gold Discovery of the Century
Westward Gold (CSE: WG) gained another 4% today to $0.13 per share! WG is drilling…
Articles
Christian Angermayer’s ATAI Is Exploding and Super Copper (CSE: CUPR) Is Next
Billionaire Christian Angermayer's AtaiBeckley (ATAI) is exploding. It is the hottest stock in the biotech…
Articles
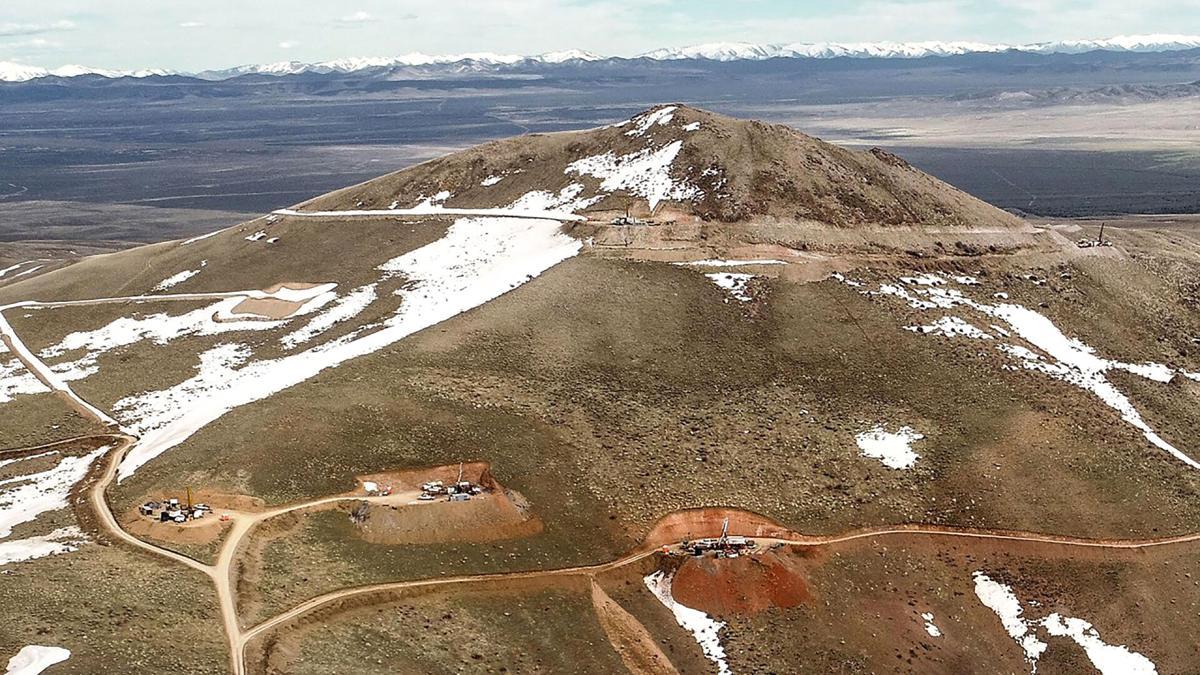
Viva Gold Still Worth Only US$33.34 Per Oz of Gold Resources
Viva Gold (TSXV: VAU) is looking very strong up 6.67% today to $0.16 per share…

Technicals
Westward Gold Gains Another 4.17% to $0.125 as Drilling Continues Next to Fourmile the Gold Discovery of the Century
Westward Gold (CSE: WG) gained another 4.17% today to $0.125 per share as drilling continues…